


I hope you enjoy reading this blog post.
If you want to get more traffic, Contact Us


Click Here - Free 30-Minute Strategy Session
Be quick! FREE spots are almost gone for this Month. Free Quote
What is the first thing that comes to your mind when you want to analyze the traffic that is coming to your website? Google Analytics (GA)? Yes, almost every marketer knows what is Google analytics all about.
Well, the fact is that nothing comes close to this Google software, as it is one of the most trusted and popular analytics across the globe today.

Click Here – Free 30-Minute Strategy Session
Be quick! FREE spots are almost gone for this Month
There is no doubt that GA helps you increase your conversion, enhance social media engagements, achieve business goals and the list never really ends.
But, the question here is . . . .
While you may already be using Google Analytics, are you sure you are leveraging it to its fullest potential?
Having said that, marketers like you should definitely know much more than a deep understanding of GA and its conversion measurement abilities.
Now, there are a few essential skill sets that you should be aware of to make the most out of it.
After all, Google Analytics reports let you know whether your marketing efforts are translating into results or not.
Unfortunately, mastering GA is not that straightforward.
It can be challenging even for seasoned marketers with great experience.
So what makes it so challenging?
Well, the answer is simple. . .
While there is way too much data around you today, the dashboards to sort out this enormous data are too few.
Besides, getting “easy-to-follow” dashboards is also extremely important to keep it simple, as clumsy dashboards will only add up to your hassle.
So, to help you out, we have put together 7 crucial reports that every marketer should be familiar with.
You can use these custom and standard reports right away to gain deeper insights into your marketing strategies and the impact they have on your business.
Let us get started without any further delay.
It is no secret that we live in a “mobile-first” world.
Today, the average number of mobile users undoubtedly exceed the average number of desktop users.
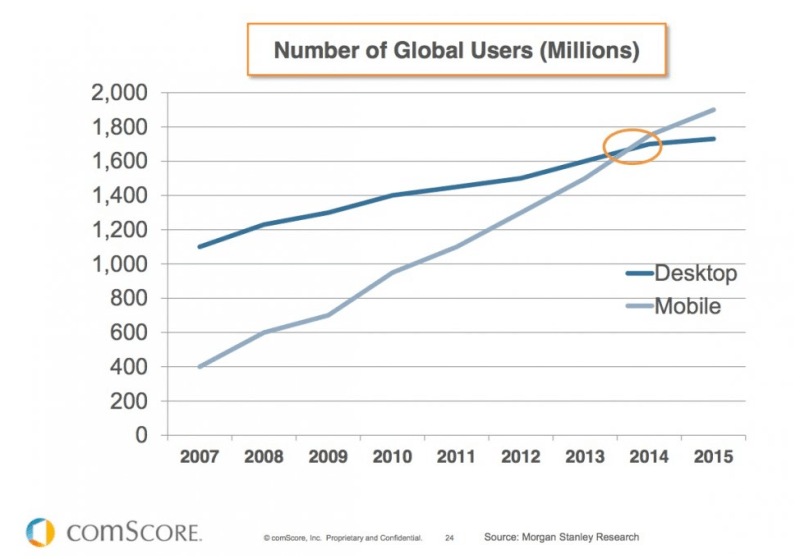
Just refer the graph below. It clearly demonstrates the exponential growth of mobile users, over a span of 9 years (from the year 2007 to 2015).
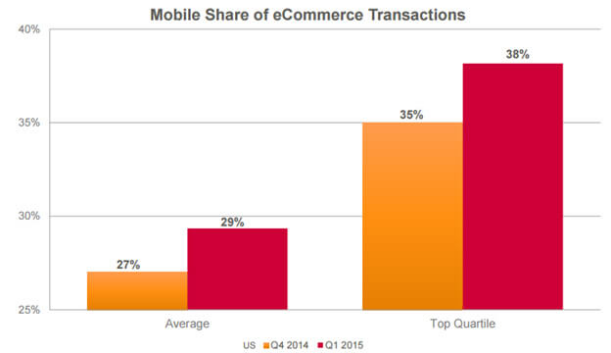
Besides, mobile e-commerce has already taken up close to 30% of the total e-commerce in the United States.
The graph below represents the mobile share of e-commerce transactions between Q4 of 2014 and Q1 of 2015.
Looking at that kind of statistics, it is no surprise that mobile has become extremely important and today Google penalizes sites, which are not mobile friendly.
So, what does that mean to you?
It simply means that for marketers like you it is important to know how your site is performing on the smaller screens.
This is extremely essential for you to stay on top of Search Engine Results Page (SERP) and win over customers.
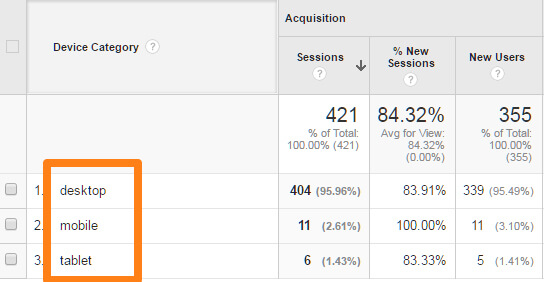
Your mobile site performance report is the one that shows how well your website (not just the mobile app) is optimized for mobiles and identify areas that need improvements.
Mobile performance reports can be further segmented to see which are the mobile browsers/devices consumers are using to access your website.
This will let you know whether your website is performing up to the mark or not on certain devices.
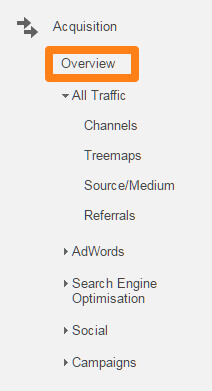
The image below explains how to access this report. It is simple.
Just go to the “Audience”, under that, choose the option “Mobile” and then select “Overview”.
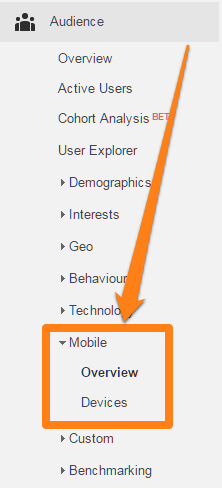
This will correctly show you how your site performs across different platforms.
Refer the image below:
Although there are less parameters here, you can go ahead and increase the number of parameters as you see fit.
However, the factors that you should take a careful note of include:
These are the vital factors that determine whether the user experience is falling across one or more of your mobile channels.
Do you want to know whether search users are actually clicking on your ads or not?
Or, check whether your guest post, which you had published earlier, is able to generate any traffic at all for your website?
What about your SEO strategies? Are they even working?
Well, who would not want answers to these questions?
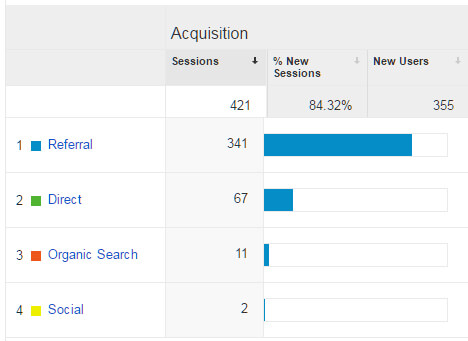
Now, traffic acquisition report is the one that tells you all this and more.
For several marketers, this is often their first step in the process of taking reports.
Traffic acquisition report is a standard report and you can easily find it by choosing “Acquisition” and then hitting the option “Overview” under it.
Refer the image below:
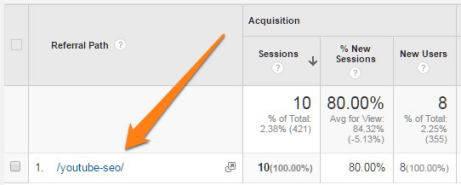
Doing this, will quickly provide you with a detailed breakdown of the traffic sources to your site.
The image below shows different sources of traffic to your website.
Note that, “Referrals” tab will be of particular interest, as it offers you with specific insights.
This tab tells you which are the external sites that are driving traffic to your website.
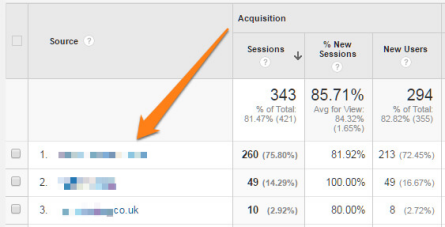
Next, when you click on those referral websites, you will be presented with the exact pages through which the visitors entered your site.
Do you regularly generate a lot of content and upload it on to your website?
Now, is tracking all that content getting a bit overwhelming?
Well, don’t worry, you are not the only one facing this issue. Many of us face the same challenge on a day-to-day basis.
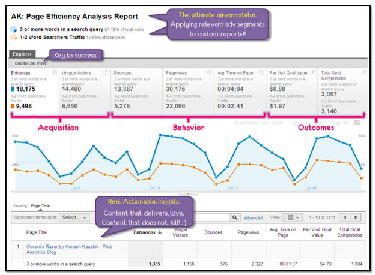
This is exactly where a content efficiency report can come to your rescue.
Content efficiency report was created by Avinash Kaushik – one of the Google’s Digital Marketing Evangelist and the author of Web Analytics 2.0.
He developed this report to track overall content efficiency.
The report is designed to track activities such as bounces, entrances, page views and goal completion.
This ultimately help you to answer important questions like:
The image below represents a quick overview from Avinash
:
However, if you are looking for a detailed explanation on this report, then please feel free to click here.
Looking for more? Or would you like to have a copy of this for yourself?
Then do not forget to checkout this link (but you will first have to login to Google Analytics).
Managing to get organic traffic from Google Analytics is certainly great.
But unfortunately, as soon as Google began encrypting the search data since 2012, we bet your keyword report on organic traffic mostly looked like this:
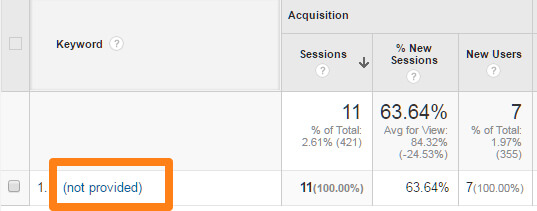
Well, don’t be disappointed.
You can still gain a lot of useful insights on your website visitors by tracking how unencrypted keywords are performing.
The image below consists of the report generated by the eConsultancy.
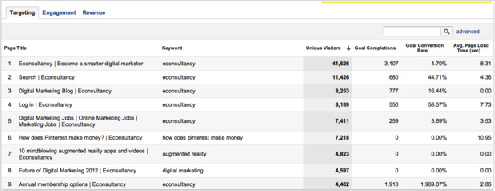
It analyzes all the available, popular keywords that come to your site.
This is one of those Google reports, which displays page load time, goal competitions, conversion rates and visitor metrics for every keyword.
Now, this data can also be used to answer the following important questions:
Getting a search user to land on your website certainly a task in itself.
But getting them to visit again, how great would that be?
Have you ever thought of it?
After all, it is your returning visitors who actually end up becoming your regular readers, customers or followers.
This is exactly where SEO analytics reporting can be particularly helpful.
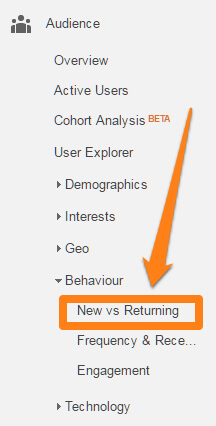
New Vs. Returning Visitors report is a standard Google Analytics report, which tells you the exact percentage of users who keep coming back to your site.
You can analyze it by going to “Audience”, then clicking on “Behavior” and finally hitting the option “New vs Returning”.
Refer the image below for your reference.
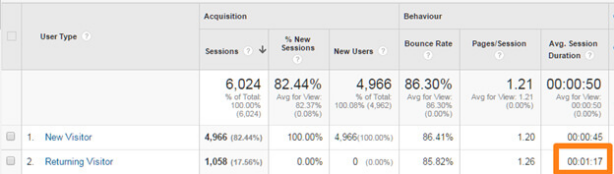
In general, the metrics are quite different for the new and returning customers.
This is mainly because the returning visitors tend to stay on your site longer and will also have lower bounce rates.
Refer the image below to see the difference in the metrics of new and returning visitors:
Users may enter your website through any page.
While some may just directly type in the URL of your home page, the others may find your page through the search engines.
Now, there is no way you can forget the traffic that comes through social media platforms.
So, you might also have users who land on your website just by clicking on the link that you shared on your Twitter feed.
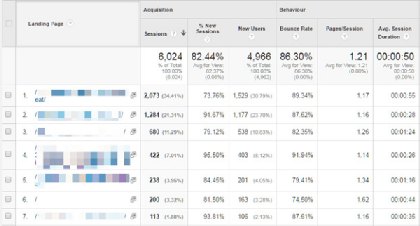
In other words, landing pages report will show you which are the pages that visitors land on, as they enter your website for the first time.
The data from this report helps you to understand how exactly users interact with your website.
For instance, your landing page report may show that some of the pages have bounce rate that is substantially higher than the others.
Now, you can use this information and take measures to make the pages with higher bounce rates more engaging.
To find the report, just click on the option “Behavior”, go to “Site Content” and finally click on “Landing Pages”.
You will get your landing pages report.
Refer the image below.
Bounce rate is nothing but the percentage of users who leave from the same page of your website where they landed from.
These visitors leave without taking any kind of actions.
Exit rate is the measure of the exact percentage of the users who go through multiple pages on your website and browse through it before they leave.
Now Bounce rate vs. Exit rate report is the one that compares these two parameters for various pages on your website.
So how do you arrive at it?
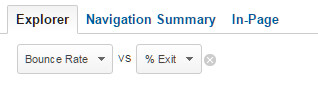
You can find it by just going to “Behavior”, choosing the option “Site Content” and finally clicking on “All Pages”.
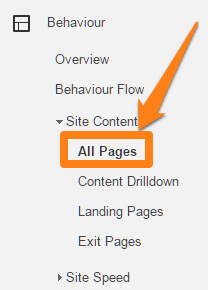
The next step would be to select the option “Bounce Rate” and then click on “% Exit” present in the Explorer tab.
Refer the image below:
This provides you with a comparison between the exit rate and the bounce rate for all the pages on your website.
However, there is an option to further drill down this data and get the exact data for each page.
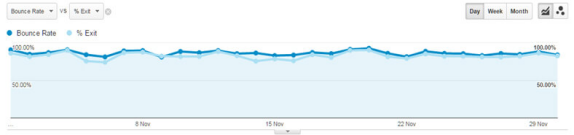
This report can also be used to detect any UX problems as well as pages having low engagement across your site.
Let’s say, your site visitors are quickly exiting your three-page blog content, as soon as they finish two pages.
So, what can you infer from this data?
You can easily understand that there is something on the second page that is causing your readers to leave as soon as they reach here.
It could be anything – a bad copy, too many ads, distracting links present in the sidebar etc.
So, with this report in your hand, you will be able to identify the factors responsible and take the necessary actions.
Google Analytics is certainly one of the most valuable analytics tools that marketers like you can leverage today.
However, using it to its fullest potential can be tricky and challenging.
So, the best way is to use a mix of standard reports and pre-created custom reports to gain valuable insights on the behavior of your website users.
Are you new to Google Analytics?
Then Google Analytics’ Solutions Gallery can be of particular use to you.
Here, you will have the provision to import some of the valuable reports that are created by the experts directly into your analytics account.
This helps you to quickly build powerful dashboards.
Besides, these reports also serve as a guide that helps you to leverage this incredible tool better to its full potential.
Did you find this post useful?
Please do share what you think of this post in the comment box provided below.
Already used one or more of these reports?
In that case, please do not forget to share your experience with this valuable tool.
We look forward to hear from you!
Be quick! FREE spots are almost gone for this Month


LEAVE A REPLY