


I hope you enjoy reading this blog post.
If you want to get more traffic, Contact Us


Click Here - Free 30-Minute Strategy Session
Be quick! FREE spots are almost gone for this Month. Free Quote
Monitoring web performance is critical for a successful website. Slow-loading pages, unresponsive interfaces, and other performance issues can impact user experience and result in high bounce rates, low engagement and lost revenue.
To regain control over your website’s performance, it’s essential to track relevant metrics, including Time to Interactive (TTI), which indicates the time required for your webpage to become fully interactive for your users.

Click Here – Free 30-Minute Strategy Session
Be quick! FREE spots are almost gone for this Month
TTI is a vital metric, especially for Google Page Speed, along with other metrics such as total blocking time. Keep track of your website’s TTI and other metrics for optimal performance.
Time To Interactive (TTI) is a crucial performance metric that measures how long it takes for a webpage to become fully interactive to users. Unlike other metrics like total blocking time, TTI focuses on the interactivity of a page and evaluates four essential criteria: the browser displays meaningful content, the page is ready to handle visible elements’ actions, it responds to user interactions within 50 milliseconds and significant scripts in the page’s code have executed, leaving the main thread idle.
It’s important to note that TTI goes beyond measuring the load time of your page, making it a vital metric for Google Page Speed optimization. Understanding TTI’s significance can help you improve your website’s performance and user experience by optimizing your page for faster and more responsive interactivity.
Keep track of your website’s TTI and other essential metrics to ensure optimal performance.
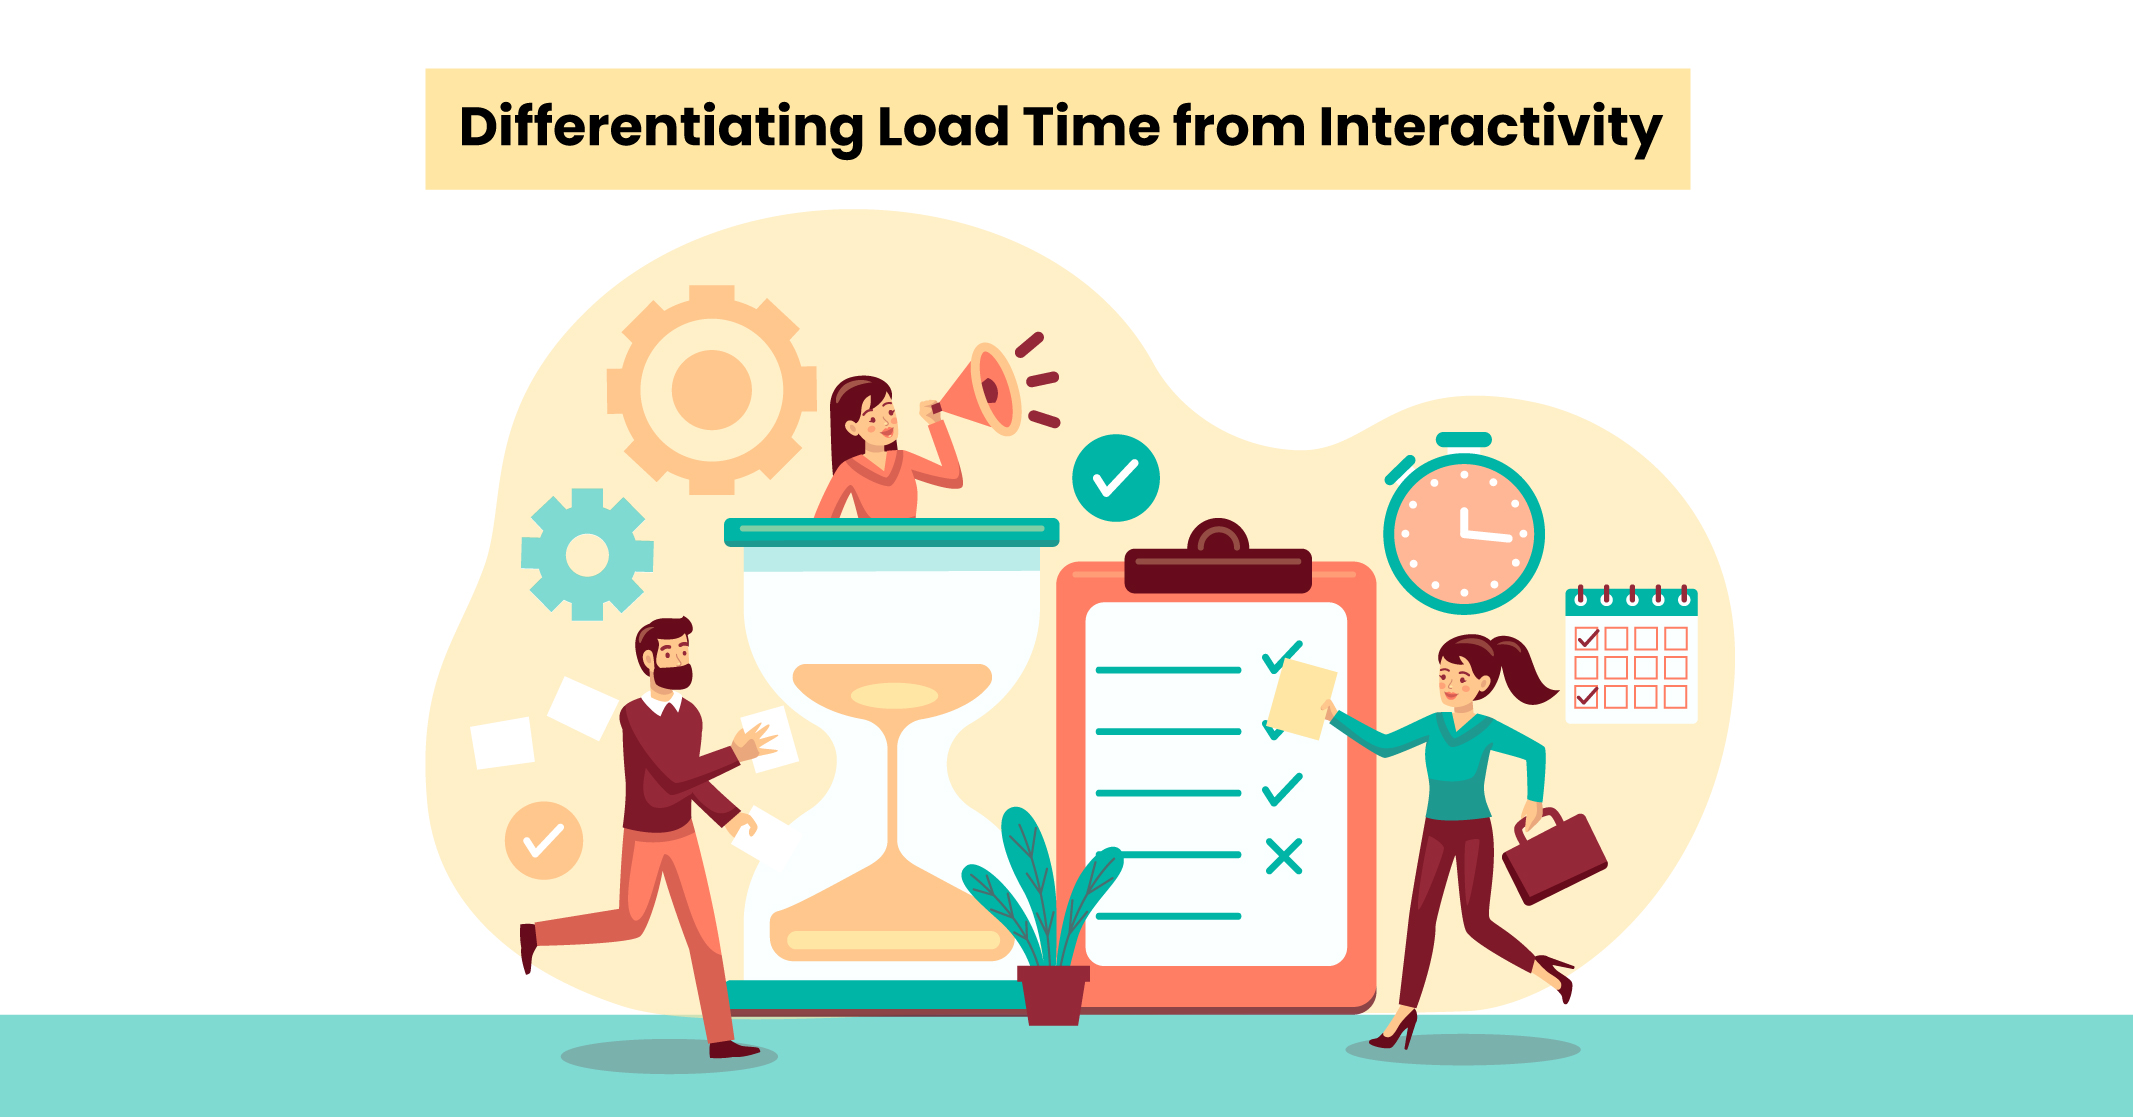
Load time and interactivity are two separate but interconnected aspects of website performance. Load time refers to the time taken to load a website’s content, while interactivity is the time taken for the website to become responsive.
The difference between the two is critical. Imagine waking up early on a Monday morning. You wake up with your alarm and yawn, but that doesn’t mean you’re ready for that call from your boss. You need a cup of coffee to become fully responsive, even though there’s nothing else to load.
Time To Interactive (TTI) is a user-centric metric that evaluates web performance from the practical perspective of potential customers. TTI is a way to check how long it takes for a website to provide users with a satisfying experience in terms of perceived speed. By controlling this time, you can lower your bounce rate and leave a good impression on your users.
TTI is determined by four crucial moments during page loading that must happen in quick succession to keep users engaged. First, the user should receive a visible signal that the page is loading.
Second, the loaded content should be useful enough to understand the page’s content. In the third step, the page should become interactive, and finally, the page should be fully interactive, allowing for smooth and uninterrupted user interactions.
When it comes to evaluating a website’s user experience, Core Web Vitals are essential metrics to consider. These three metrics are Largest Contentful Paint (LCP– measuring perceived load speed), First Input Delay (measuring responsiveness), and Cumulative Layout Shift (measuring visual stability).
While other metrics aren’t considered “core,” they still provide valuable insights into a website’s speed. Time To Interactive (TTI) is one such metric that measures how long it takes for a page to become fully interactive for users.
Although TTI may not be a Core Web Vitals metric and may not directly impact your Google rankings, it’s still worth measuring. A good TTI score can lead to a lower CLS, and TTI remains a relevant measure of how users perceive your website early in their visit.
TTI is a metric used to measure how long it takes for your website to become fully interactive for your users. To calculate TTI, you need to determine the First Contentful Paint (FCP) and the first 5-second quiet window.
FCP is the moment when the browser first displays something on the user’s screen, such as text or an image. The quiet window is a period of 5 seconds when the browser doesn’t perform any tasks that take more than 50 milliseconds on the main thread or wait for more than two server response requests.
TTI is the point in time between FCP and the end of the final long task before the quiet window. This means that TTI measures the time it takes for your website to become fully interactive after the FCP.
To better understand how your page loads, you can use a timeline visualization. This will help you see how long it takes for each element of your website to load and how long it takes for the website to become fully interactive.
To calculate the TTI score, you first need to define the FCP. FCP refers to the first point in the page load timeline when the user can view anything on the screen. However, it’s important not to confuse FCP with LCP, which measures when the largest element on a web page becomes visible. While LCP occurs before a page is fully interactive, it doesn’t affect TTI calculation.
Let’s break down the loading process of your webpage. The browser executes several scripts, some of which take longer than 50 milliseconds, which are important for measuring TTI. The browser also asynchronously sends resource requests to your server, and each request remains “open” until it receives its response.
After some time, the browser can finally take a break known as the “quiet window.” It’s the first time that, for at least five seconds, it doesn’t have to perform any long task on the main thread, and it has no more than two resource requests open. FCP always occurs before the quiet window, and together they define the time frame to identify your TTI.
To calculate your TTI score, you need to pinpoint the exact moment when the final long task before the quiet window is completed. This moment represents the TTI, which is the time that the user will have to wait until they can fully interact with the website.
To calculate TTI, focus on the time between FCP and the start of the quiet window. Look for the moment when the browser completes the final long task before the quiet window. If there are no tasks longer than 50ms after FCP, then your TTI score is equal to your FCP.
Distinguishing between Time to Interactive and First Input Delay can be challenging.
First Input Delay measures the time between the First Contentful Paint and the moment when the page responds to user interaction, while TTI calculates the time it takes for a page to become fully interactive. Therefore, it’s important to understand that TTI does not measure the page’s responsiveness to user interaction.
To ensure your website provides a positive user experience, it’s recommended to achieve a Time to Interactive score of less than 5 seconds. This score is considered good according to Lighthouse, a web performance auditing tool.
In the past, measuring TTI (Time to Interactive) was typically done through a Lighthouse performance audit of a website. However, Google is now updating its Lighthouse 10 tool, which involves removing TTI from its performance score and placing more emphasis on CLS (Cumulative Layout Shift). CLS will now account for 25% of the overall performance score, while TTI will make up just 10% of that quarter.
As a result, other tools such as Google’s PageSpeed Insights and WebPageTest may be used as alternatives to measure TTI scores.
Learn More: How to Improve Your Google PageSpeed Insights Score?
PageSpeed Insights is a free tool from Google that helps website owners analyse their website’s performance and provides recommendations to improve it. One of the key metrics that PageSpeed Insights measures are the load time of a website, which is a crucial factor in determining TTI.
PageSpeed Insights provides detailed insights into load time, including the time it takes to load the first contentful paint (FCP), the time it takes for the largest contentful paint (LCP), and the time to interact. By optimizing these metrics, website owners can improve the overall performance of their site and reduce the time it takes for their site to become interactive, ultimately leading to a better user experience.
WebPagetest is another tool that website owners can use to measure TTI. This free tool allows users to test the performance of their website from multiple locations around the world using real browsers.
When testing TTI with WebPagetest, users can view detailed metrics such as the time it takes for the page to start rendering, the time it takes for the page to become interactive, and the time it takes for all the page’s resources to fully load. By optimizing these metrics, website owners can improve the overall performance of their site and provide a better user experience to their visitors.
WebPagetest also provides a waterfall view that displays the loading sequence of all the resources on a page, allowing users to identify which resources are slowing down the page and optimize them accordingly. Additionally, the tool provides recommendations for improving the performance of a website, making it a valuable resource for website owners looking to improve TTI and overall site performance.
Modern websites often use a significant amount of JavaScript, which can cause slow TTI. Long JavaScript tasks, taking more than 50ms, can delay TTI by consuming a significant amount of time on the main thread.
Since the main thread is responsible for various tasks in the browser, long tasks can make the webpage unresponsive until the task is complete.
JavaScript code that results in long tasks can cause delays in TTI, as it prevents the browser’s main thread from carrying out important tasks such as page rendering or user interaction. This can significantly slow down page loading times and create processing demands for browsers, ultimately impacting the user experience.
By optimizing JavaScript code to minimize render-blocking and long tasks, website owners can significantly improve TTI and overall performance.
In the field of SEO, it is widely understood that while JavaScript can improve a website’s visual appeal and interactivity, it can also hurt web performance. Specifically, when JavaScript code is the render-blocking resource, it can significantly slow down page loading times and create significant processing demands for browsers.
Improving TTI involves optimizing JavaScript code and reducing server response time, both of which are crucial for enhancing website performance. By optimizing JavaScript code and reducing server response time, website owners can significantly improve TTI and provide a better user experience.
To improve your WordPress site’s TTI score, you can use various plugins. Here are a few options to consider:
Using these plugins can help optimize your site’s performance and improve its TTI score. Remember to regularly monitor your TTI search scope and make changes as necessary.
TTI, or Time to Interactive, is a crucial website performance metric that measures how long it takes for a website to become fully interactive for users. When a web page loads, the browser executes scripts and sends resource requests to the server. To determine TTI, you need to focus on the time between FCP and the start of the quiet window and observe when the browser finishes the last long task before the quiet window.
While Google’s Lighthouse 10 tool now prioritizes CLS (Cumulative Layout Shift), TTI optimization can still enhance user experience. To improve TTI, focus on optimizing JavaScript code and reducing server response time. It’s recommended to aim for a TTI score of under 5 seconds.
Be quick! FREE spots are almost gone for this Month


LEAVE A REPLY