


I hope you enjoy reading this blog post.
If you want to get more traffic, Contact Us


Click Here - Free 30-Minute Strategy Session
Be quick! FREE spots are almost gone for this Month. Free Quote
Statistics on search engine marketing helps you to understand how frequently search engine marketing is being used by the marketers today. Search engine statistics also helps you to identify and devise the right search engine tactics and strategies.
Often, these search engine statistics will be the strategies and tactics that are tried and tested.

Click Here – Free 30-Minute Strategy Session
Be quick! FREE spots are almost gone for this Month
Search engine statistics will help you to transform the existing data into valuable piece of information.
Search engine statistics ultimately help you to make rational and informed decisions, which is the actual purpose of this blog too.
We strongly recommend search engine marketing.
However, not everybody believes in the potential of search engine statistics – how it can be beneficial to a growing business.
Search engine marketing can either be paid search marketing or just search engine optimization.
Businesses across several countries are actively using adwords – a paid search marketing channel.
Google search statistics help you to streamline your efforts.
In this article on the search engine statistics and top search engines, we look forward to help make better informed decisions while running search marketing campaigns with the help of best search engine marketing tactics.
Let us now dive into some of the glaring search engine statistics that you are supposed to know.
Net Market Share states that the worldwide search marketing percentage share heavily favors Google, throughout the year 2017.
However, this search engine statistics number is merely in terms of the search engine usage.
The net share of Google was 74.54%.
This search engine statistics clearly reinforces that Google is one entity that still reigns the market and is a market leader.
However, it is also highlighted that other such as the Bing market share, Baidu and Yahoo also have large audience.
So, it would be silly to just ignore these entities, which average somewhere between 5 to 10 percent of the overall market share and consider just Google people search.
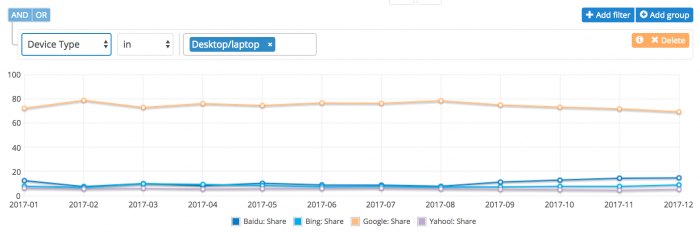
While Google holds the maximum market share, it is slowly been decreasing with Baidu gradually witnessing increase in the market share.
Badui is slowly rising and has reached to 14.69%.
Other search engines hold 1% of the global search engine market share and these include duckduckgo, Ask and AOL.
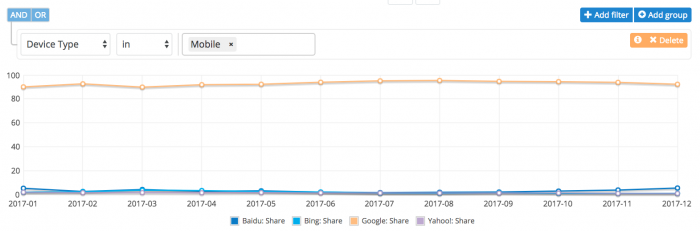
However, when it comes to mobile platforms, Google still dominates the market share by holding over 90% of the global market share.
Considering the accessibility of the Chrome to mobile devices, this number should not be surprising.
Also, there are changes in mobile indexing to offer top quality UX design and high quality search results.
While Badui holds just 5.44% of the mobile market share, Bing and Yahoo hold less than 1% of the market share each.
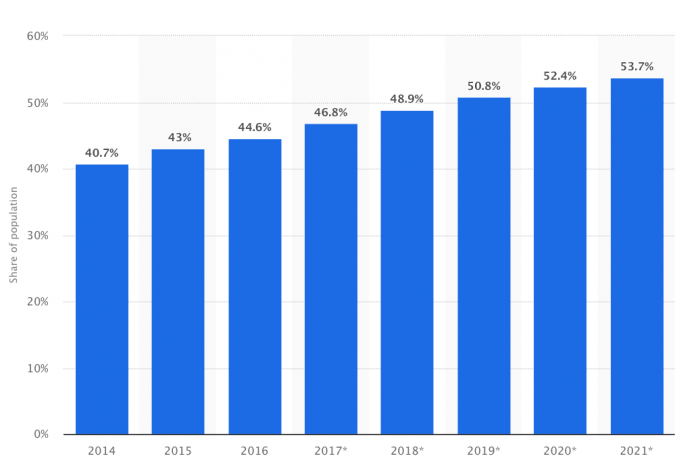
As Google is one of the most popular search engines, let us consider it today. Year 2017 saw 46.8% of the global population accessing the world wide web.
However, by 2021, this number is expected to shoot up to 53.7%.
The number of users leveraging search engines and internet is gradually increasing with every passing year.
The market share chart provided above along with the data from Live Internet stats, provides the number of daily searches that is done on Google.
The daily searches sum up to 3.5 billion, which ultimately sums up to 1.2 trillion searches worldwide per year.
Search engine statistics show that search engines have come a long way since 1999, where Google actually took a complete month just to index and crawl 50 million pages.
This gets really interesting. In 2012, Google took less than a minute to do the same.
So, internet is heading at a pace that is much faster than we all imagined it to be.
Now, it is important for marketers and website owners like you to keep up with the stats to keep your content seen.
Understanding and keeping up with your target audience is important. It is also critical to know what are they searching through – mobile or desktop.
This is extremely critical, as it helps you to design the landing pages accordingly. Search engine statistics will help you to do just this.
Today, there is no way you can forgo responsive design as it is a must today to serve the mobile users better with good UX.
The content also should be optimized accordingly for ease of access and readability.
The mobile versus desktop top ratio has been continuously fluctuating and at one point the number of mobile users had already surpassed the number of desktop users.
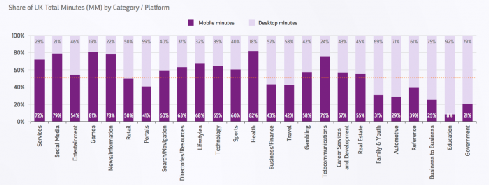
Including the US and Japan, most of the Google searches are carried out on the mobile devices than on desktop, across 10 different countries.
Furthermore, BrightEdge also states that 47% of the keywords (ranking between the position 1 and 20) as well as 79% of the overall keywords, rank in a different way on SERPs across desktop and mobile platforms.
Industry sectors like news and media, health care, social media and games often have maximum mobile searches and shares.
On the other hand, portals, finance and B2B will have highest possible searches on the desktop.
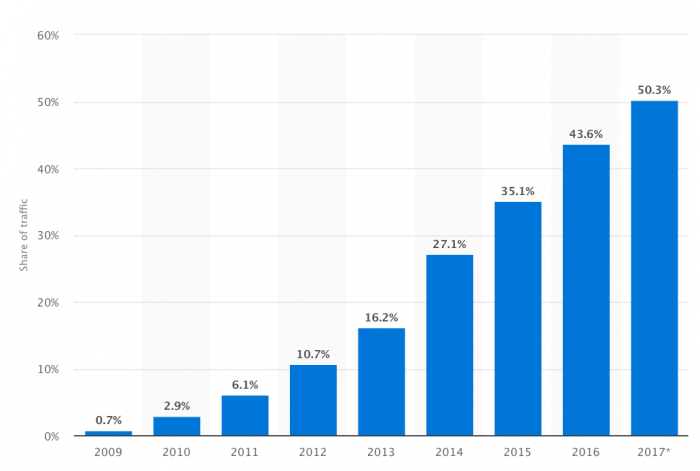
Year on year mobile platforms have witnessed a gradual increase in the website traffic.
Year 2009 saw only 0.7% of the worldwide web traffic was generated through mobile platforms.
However, this slow rate can be definitely attributed to the slower internet connections as well as lack of websites that were mobile friendly.
Technological advancements along with the quick growth of the smartphones over the past 9 plus years, have made mobile internet usage more simple, accessible and quicker.
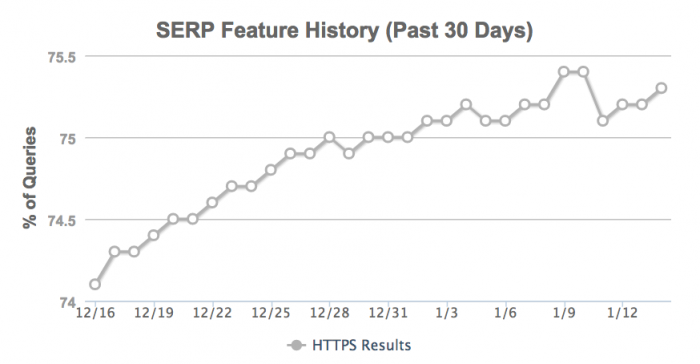
Moz have a highly interactive great SERP feature graph and it enables you to choose the SERP features.
You can select the ones that are important to your business and check the percentage of the queries for that particular feature.
For instance, results from the domains like HTTPS have gradually received increased exposure on the SERPs – roughly, we can say from 74% to close to 75.5% over a span of 30 days.
SERP feature graph of SERP is certainly a great attribute for continuously checking the changes that occur across the Google SERPs.
This is along with the significance of switching the websites to HTTPS.
Google stated that security is an important element and the sites with the HTTPS are the signals to Google’s algorithm.
Other features that are usually measured include the related questions, reviews, adwords etc.
Now, Adwords which get displayed at the top of search engine results pages will be shown for over 48.6% of the queries.
However, the marketers here should streamline their focus towards a set of wider aspects of search marketing apart from SEO.
Google advertising and the PPC campaigns are also extremely advantageous.
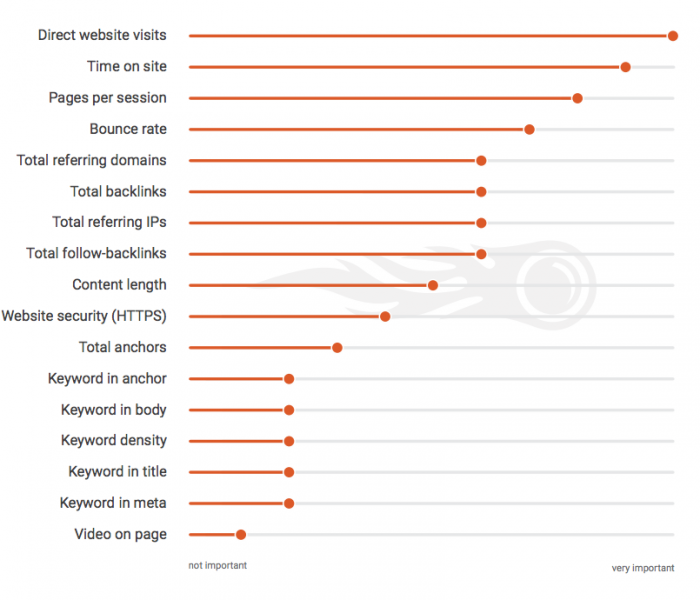
According to SEMrush the total number of direct visits to your website is known to positively impact your position on the SERPs organically.
Also, the metrics uphold the fact that higher engagement have a greater impact on the organic ranking when compared to web content.
Bounce rate, time spent on website and pages per session are some of the metrics that point towards better quality results and hence Google prioritizes websites based on these factors.
Search users will often be sure about the brand that look out for. They would have already seen those brands on social media channels, TV etc.
So, will branded queries have higher CTR when compared to the non-branded ones?
That is when users ask a question, will they be open to a particular business or a marketer presenting them with a suitable answer.
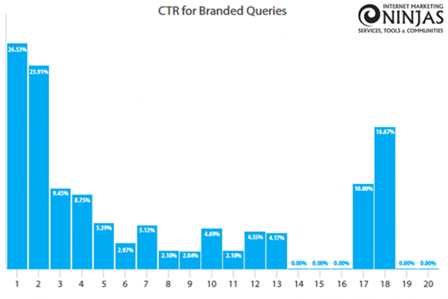
Internet Marketing Ninjas completed a study, which showed that the branded queries were found to have much higher CTR on the first page of the Google – particularly the first page.
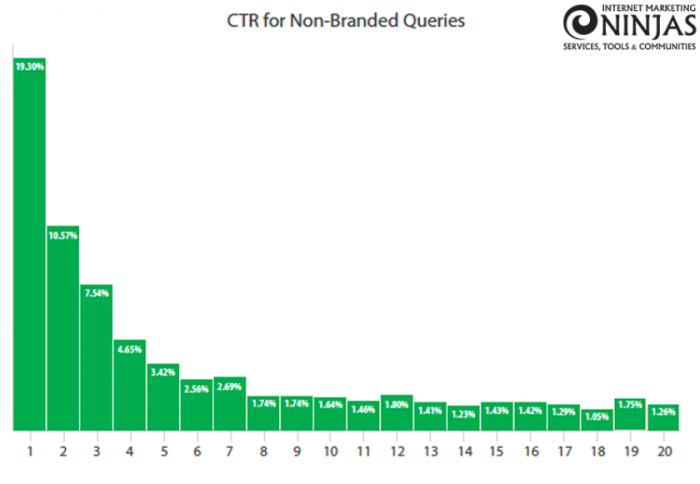
Surprisingly the results 17 and 18 are also known to have higher CTR. On the contrary, non-branded keywords are known to have a gradual decline in the CTR.
While the average CTR for the top most position is 19.30%, the CTR for the second highest position is 10.57%, which is almost half.
In 2017, the average click through rate for the search results on desktop, the ones ranking for the position 1, was higher accounting for a CTR of 31.52%.
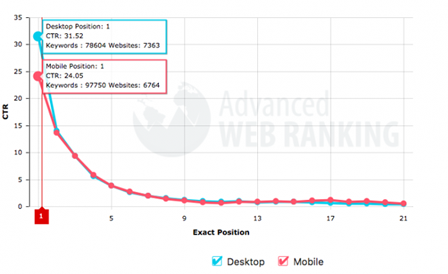
However, the site ranking at the top of the SERPs on the mobile platform had CTR of only 24.05%.
So, click through rates gradually decline for the those ranking at the lower positions on the SERPs.
Not only does the CTR declines, but it declines at a rapid rate and the difference between, say the first and the fifth position will be somewhere close to 25%.
This shows the high importance placed by the search marketers to rank higher at the top of the search results pages.
The huge difference in the CTR between the first and fifth position shows that searchers less likely scroll down.
This is because scrolling down involves more time. Furthermore, the top few of the results are the ones that are highly trusted by the Google too.
This trust places them at positions much higher than those that are on page 3.
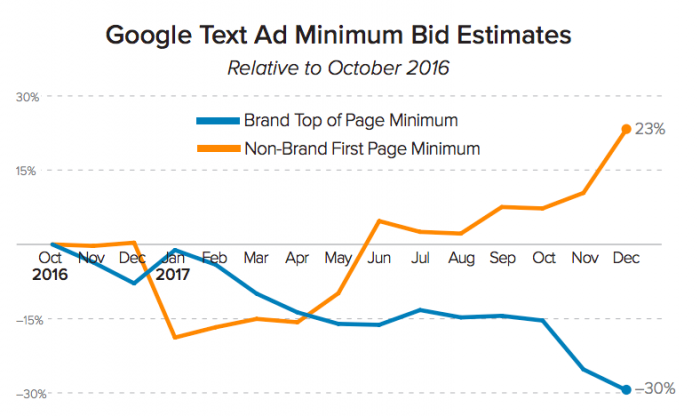
It is extremely important to know how high you can set the maximum cost per click against the ad relevancy score because it helps you to understand the actual position of your ad on the search engine result pages.
According to DMR, the min bid for the non-branded keywords has drastically increased to as much as 23% in order to get better visibility on the first search results page.
Wordstream have come up with a multiple infographics considering all the averages across adwords metrics.
These include cost per click, average conversion rate, cost per action and average CTR across 20 different industries.
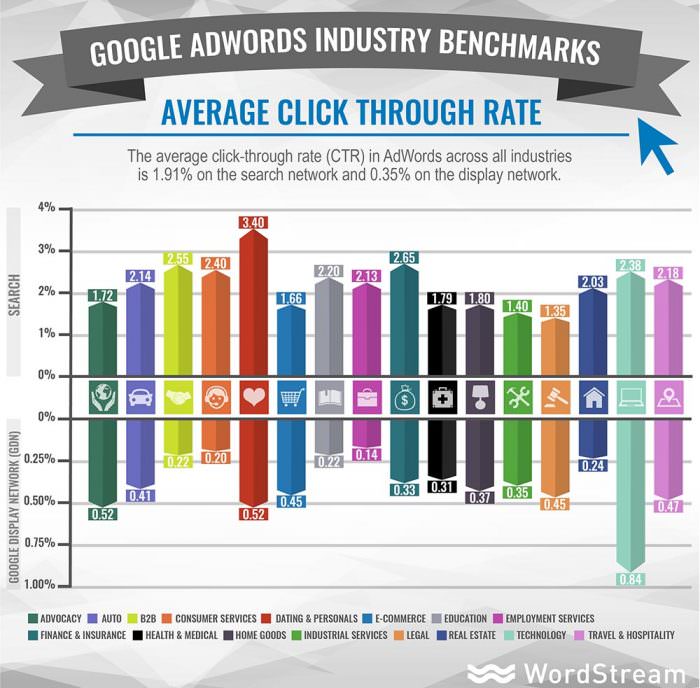
The report showed that dating sites were much ahead when compared to the rest of the industry sectors accounting to 3.4%.
The other high-flying sites included those from B2B (2.55%), finance (2.65), technology (2.38%) and consumer service (2.40%) industry sectors.
Some of the industry sectors that have managed to flag a little include eCommerce (1.66%), industrial (1.40%) as well as legal (1.35%) services.
While it is surprising to find eCommerce so low when it comes to CTR, this could be due to high competition and numerous poorly set up eCommerce stores.
The CTR on search has gradually increases year on year with the 20% of the top most pulling away from various other industry sectors.
However, this is not the case with financial sector. Financial services are making grounds on all the above mentioned industries.
So, if you fall into this sector, then it is high time you gear up and explore PPC, as there is a huge push with the paid ads.
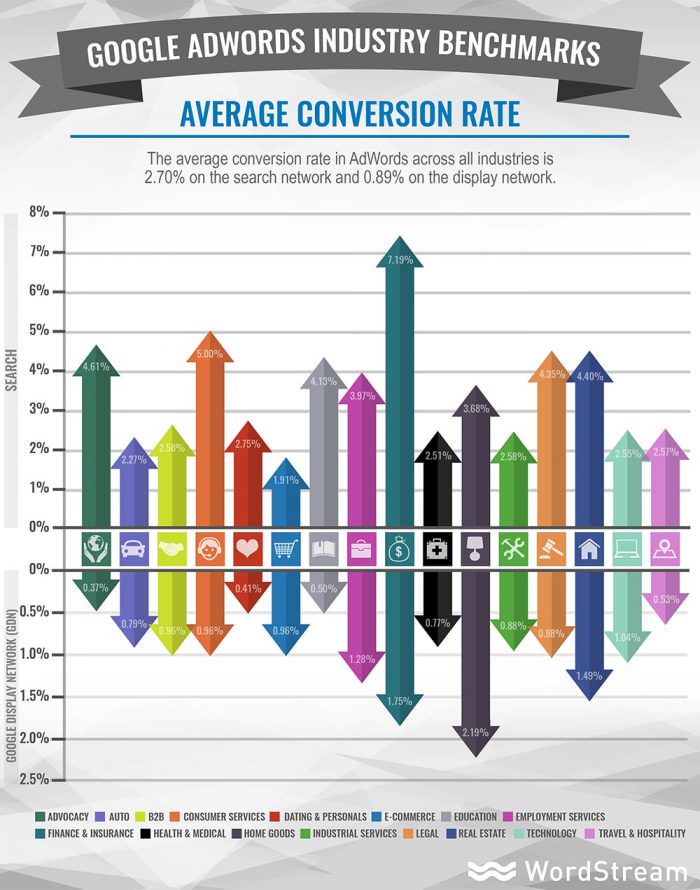
Surprisingly, here it is the insurance and the finance industries that convert the maximum. With a CVR of 7.19%.
This makes sense to see the sudden upsurge of interest towards PPC, when it comes to the financial sector.
On the contrary, dating sites have lowest average CPA on both – search as well as display.
Employment, legal and medical have the the highest possible CPA.
However, this gets outweighed by lifetime values of new clients or customers.
Hope this statistics left you with a fair idea of search marketing.
If you still want to know more about particular statistics, then feel free to leave your queries in the comments section below.
Be quick! FREE spots are almost gone for this Month


LEAVE A REPLY